Benchmarks: Using Portfolio Benchmarks

Getting Started
Portfolio benchmarks let you see how usage of the channels and tactics in your portfolio lines up with other brands. When this data is taken in context with the results of your efforts, it will help guide how to spend your media budget in the future.
It is recommended to check your benchmark data at a weekly cadence. This will keep you up to date with Measured’s schedule for updating all benchmark data.
This article covers a specific aspect of Measured Benchmarks. To get more general information about the feature and see instructions on other parts of it, see our Benchmarks Overview article.
Using Portfolio Benchmarks
With Portfolio selected in the upper-left of the page, you’ll be able to adjust the settings seen below.

View contains the following options:
- Active Channels or Tactics show data on what you use most
- Inactive Channels or Tactics let you inspect tactics you have not used during your selected time period
Metric contains the following options:
- Spend Allocation shows how much of your budget was spent here. These values are relative to your specific business strategy and should be taken in context with the overall results.
- CPM/CPC lists the cost per thousand impressions or cost per click on your ads. Lower values indicate a stronger return on your ad spend. Higher values aren't necessarily bad, as they mean your ads for this channel or tactic are more likely to appear.
- Conversion Rate is the percentage of your total conversions divided by impressions or clicks. High values here indicate that your ads successfully led to people taking the desired action.
- Incremental ROAS is the incremental revenue earned for each dollar you spent on advertising. High values indicate that a channel or tactic is operating efficiently and it's worth considering an increase in spending, while lower values mean cutting back is a good idea.
- Incremental Orders % shows the incremental percentage of all orders that were generated. Similar to Incremental ROAS, you want your values here as high as possible, and lower values mean you should reconsider how much you're spending.
Time Period lets you select a date range for the data to be displayed.
Category contains the following options:
- All Brands lets you compare your metrics to all brands within Measured.
- A specific industry will let you narrow that focus to just brands within Measured that are in the same field as your business.
- AOV (or Average Order Value) will compare your metrics only to brands whose order prices are within a similar range to yours.
Active Channels and Tactics
If you select Active Channels or Tactics from the View settings, you will see your data listed as shown below.
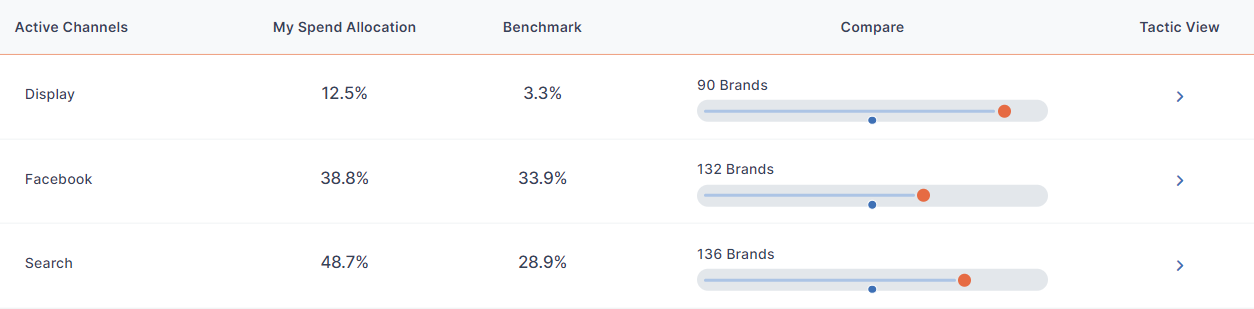
Alongside your channel/tactic and chosen medtric, you’ll also see the following:
- Benchmark is the median for your metric among the group of brands you’ve selected. Note that this is the midpoint and not the statistical average.
- Compare is a visual representation of where you stand in comparison to the other brands. The dot in the center of the bar represents the figure from the Benchmark column.
Additionally, clicking the arrow for Tactic View while viewing channels (or Full View if you're viewing tactics) will take you to a page displaying all possible metrics for the channel and their placement in comparison to the benchmark.
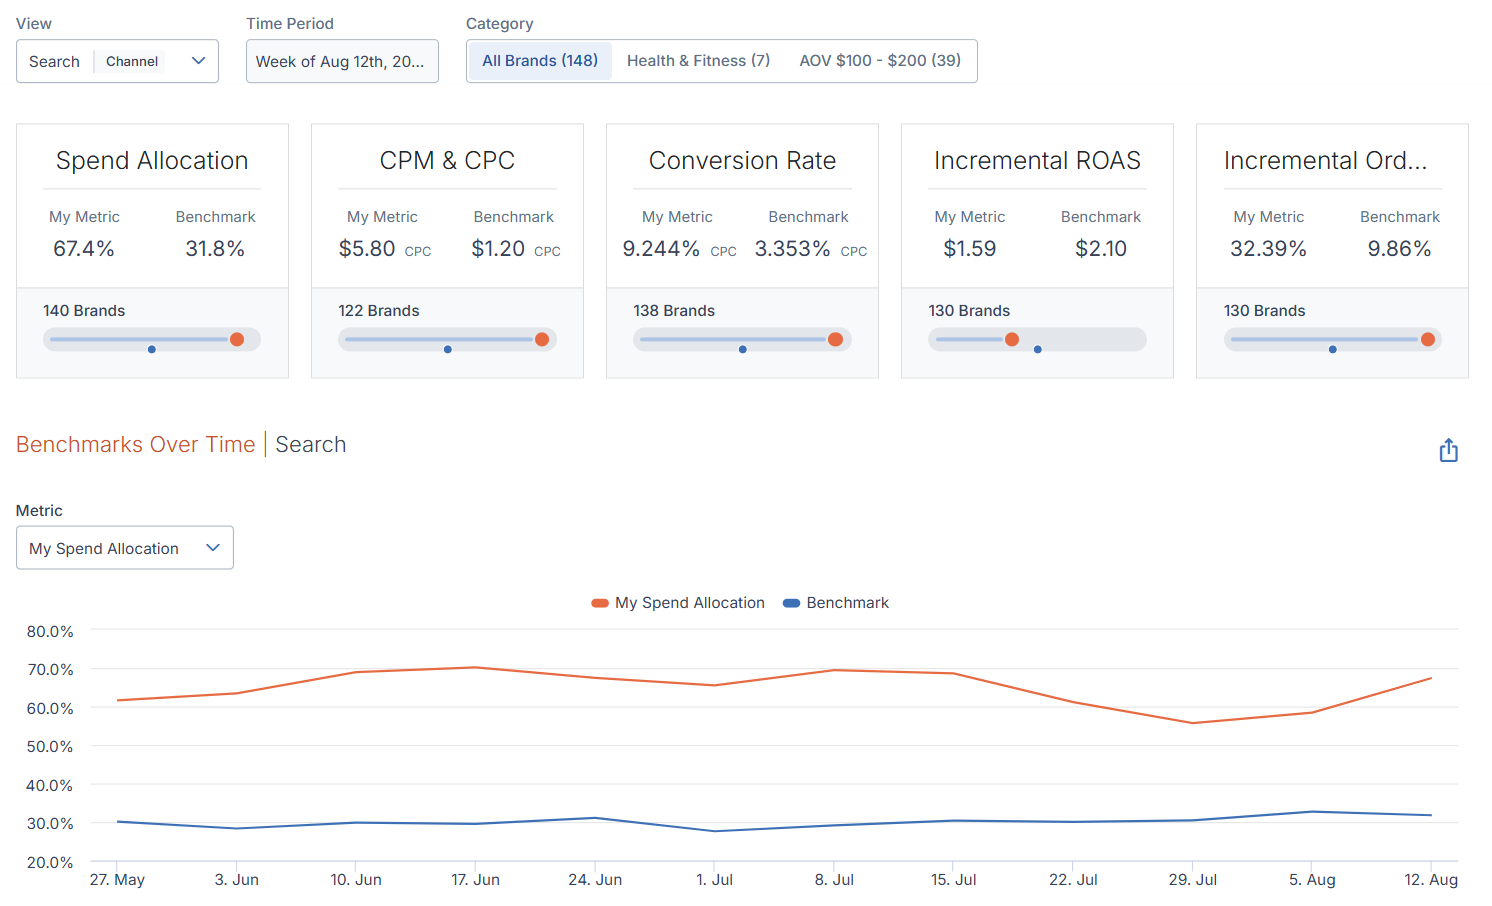
On the Tactic/Full View page, you will also see a graph of your metrics’ changes over time. Hover your cursor over a specific point in the chart to see specific data about that point in time.
Inactive Channels and Tactics
If you select New/Inactive Channels or Tactics from the View settings, you will see your data listed as shown below.
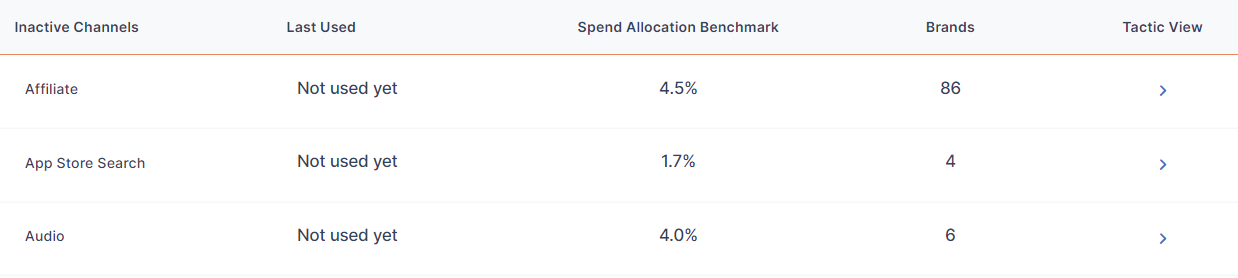
You will see your channels or tactics, whether they are new or inactive, and the following:
- Benchmark is the midpoint for your metric among the group of brands you’ve selected. Note that this is the midpoint and not the statistical average.
- Brands is the number of other brands in your selected category that the benchmark is drawn from.
Similar to the Active Channels/Tactics view, you can also click the Tactic View arrow when viewing channels (or Full View if you're viewing tactics) for a comprehensive breakdown of all of the associated metrics and a graph of changes over time.
FAQs
Why are my tactics labeled differently than on my Cross-Channel Dashboard?
Every brand has different names for similar tactics. For benchmarking, we combine similar tactics together into a single group. (For example, Facebook Prospecting.) If any of your tactics are not mapped, we will label them as unmapped. If you have questions or would like to review the mapping for your tactics, contact your client success partner.
Why is the media performance data for some of my tactics showing as empty?
Tactics and channels may not have the data needed for certain indexes, such as CPM values. However, you will still see them in your list of tactics.
Why don’t the median allocations across tactics and channels add up to 100%? And why are there different index sizes across different cuts of the benchmark reports?
We build each index and benchmark individually. For instance, the media mix index for linear TV only contains brands active on linear TV. Not all brands are active on every channel or tactic. Because of this, each of these indexes represents a subset of brands instead of all of them.