Benchmarks: Using Growth Benchmarks

Getting Started
Growth benchmarks help you track your brand’s spend, revenue, and orders in comparison to other brands.
These metrics are tracked on a year-over-year basis. By comparing your current performance to both previous times and your peers, you can determine how best to proceed in the future.
This article covers a specific aspect of Measured Benchmarks. To get more general information about the feature and see instructions on other parts of it, see our Benchmarks Overview article.
How to Use Growth Benchmarks
With Growth selected in the upper-left of the page, you’ll be able to adjust the settings seen below.
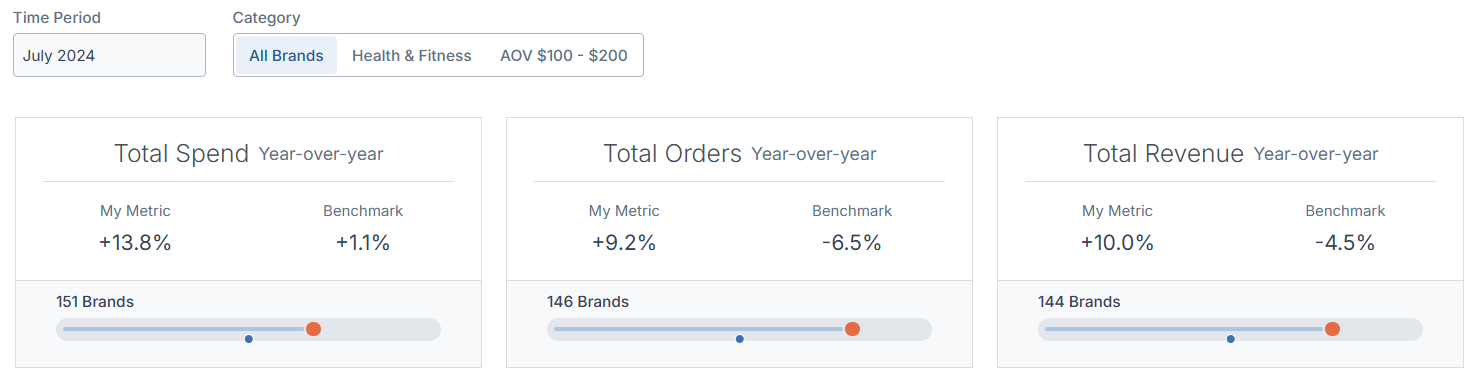
- Time Period lets you select a date range for the data to be displayed
- Category gives you a choice between comparing to all brands within Measured or a specific subset of them
Under the settings, you’ll see information based on your selected parameters. Each metric will show a comparison bar. The dot in the center represents the group benchmark shown above as a number, and your metric will be represented as the orange dot within the bar.
You will also see a graph of your metrics’ changes over time. Hover your cursor over a specific point in the chart to see specific data about that point in time.