MIM: Using MIM Explorer

Getting Started
Reporting for the Measured Incrementality Model (MIM) is available at any time within your account. It shows the range of expected incrementality for each of your tactics.
Note that this screen is primarily used when your business’s incrementality model is being calibrated during onboarding. You can access it anytime, but the top-level information it contributes to is visible from your Cross-Channel Dashboard.
Adjustable Settings
Along the top of the screen, there are options for narrowing the scope of your MIM reporting. Your settings show all possible inclusions by default, but can be adjusted for specificity.

- Time Period lets you set the date range for the data you'll see. This date range will determine further filtering options based on what was present during that time.
- Conversion Type lets you choose between viewing all of your business’s conversions or only specific kinds.
- Channel shows all of your channels by default but can be used to only show the ones you choose.
- Segments lets you decide which part of the marketing funnel you want your reporting to represent.
- Tactics can be set to only show specific tactics, which are strategies applied to your channels.
(Note that your reporting output will only show tactics related to the channels, segments, and tactics you have selected.) - Incrementality Settings lets you see how your results would be affected if different incrementality was applied. These changes will not affect your account and are simply for exploratory purposes.
- Current displays the incrementality that was used during the chosen time period.
- Low, Medium, or High will apply the selection to all metrics in the reporting output.
Reading Your Output
The majority of the MIM Explorer page is your most recently updated metrics. By default, these will reflect all of your channels and tactics with your current incrementality model applied. They will change based on the settings you have chosen.
Incrementality Trends Graph
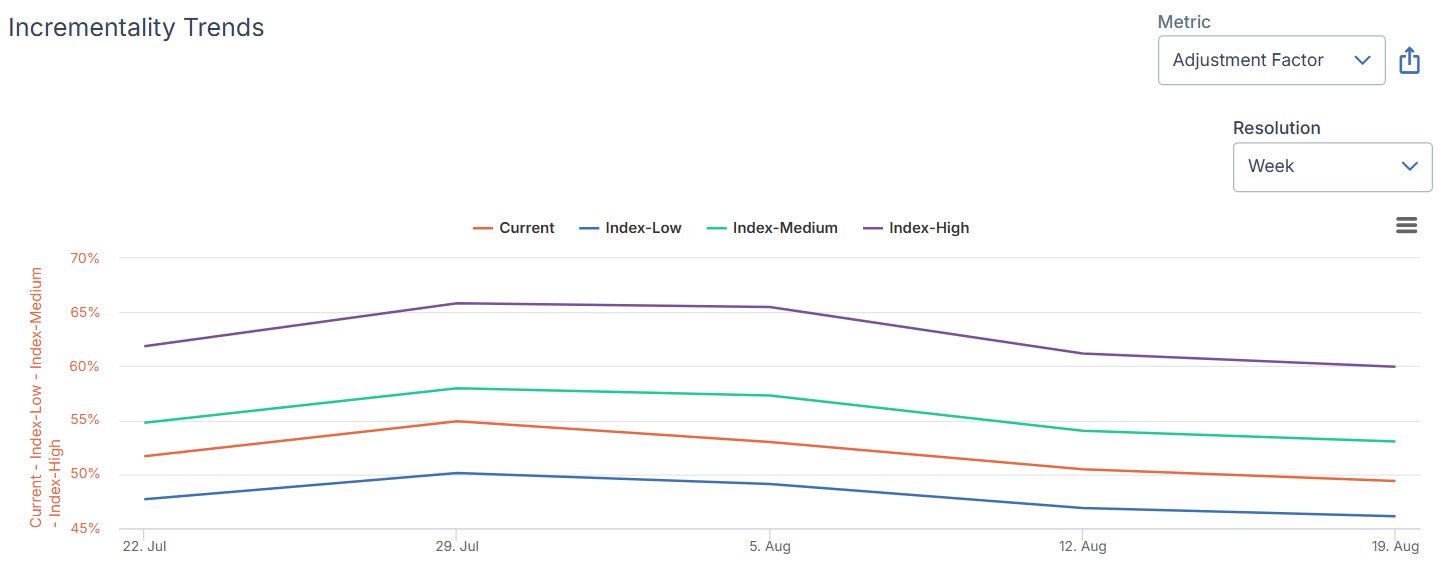
This chart displays the metric you have selected in the upper-right corner over your chosen time period. It shows the current incrementality setting (or what it was during the date range) alongside what it would have been at high, medium, and low incrementality settings.
Portfolio-Level Metrics
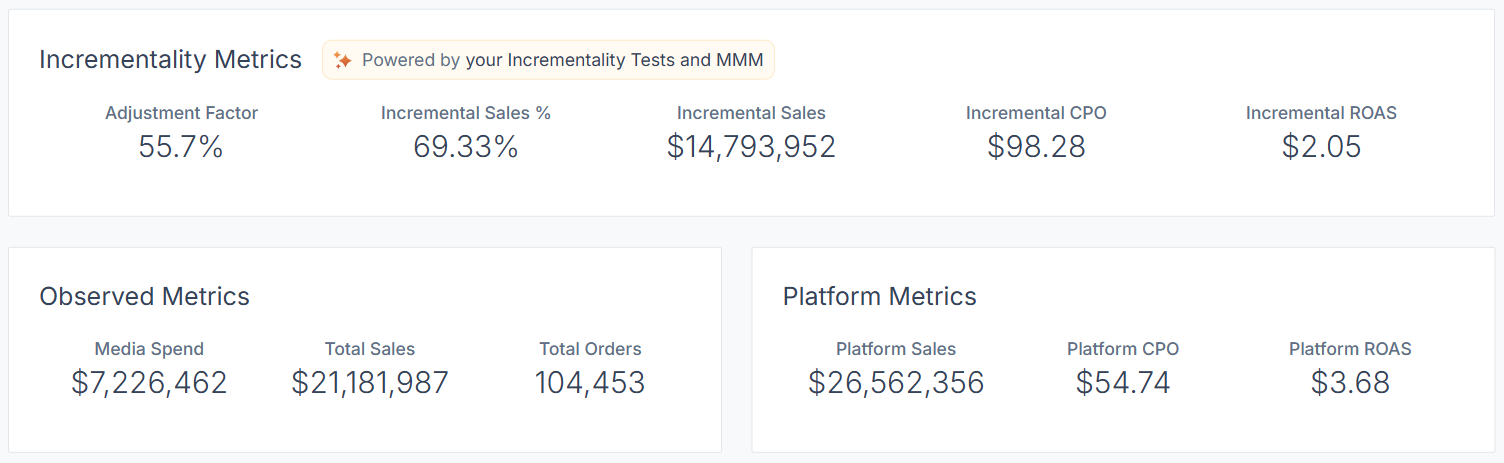
Next, you’ll see three categories of metrics derived from the specified settings:
- Incrementality metrics measure the true results of your performance. The most important takeaways here are your end results, such as Incremental ROAS and CPO.
The incrementality percentage by itself is neither good nor bad — the best gauge of your performance will be your end metrics which represent your bottom line. - Observed metrics represent the data we pull from your transaction data systems and ad accounts.
- Platform metrics show the figures your media platforms are reporting. Those platforms tend to over or under-report performance since their attribution models are based on what might have happened instead of what actually happened.
Vendor metrics stand in direct comparison to your incrementality metrics, which are more accurate.
Incrementality Calibration Table
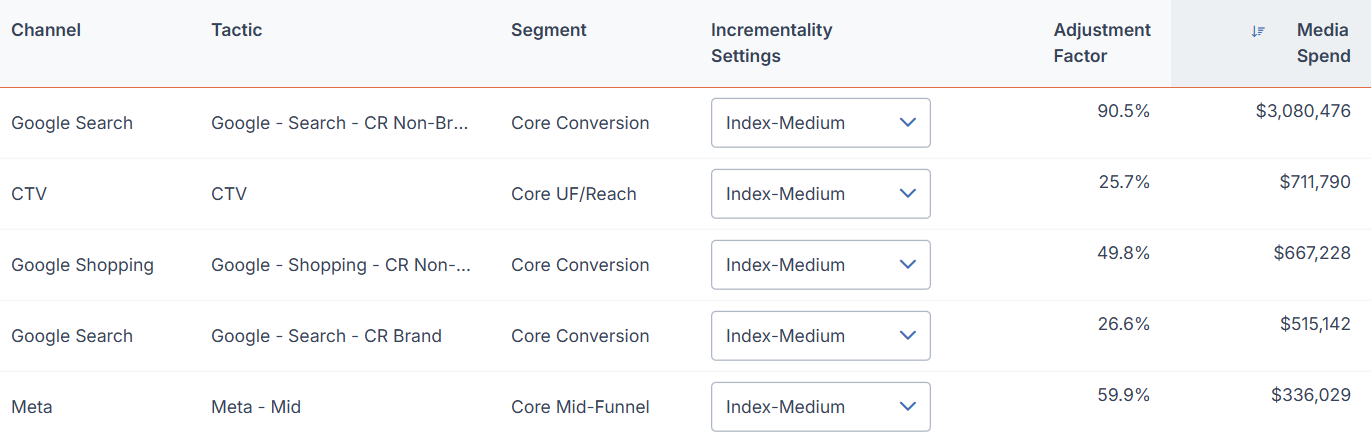
Finally, you’ll see a table containing all of the channels and their related tactics that fit the settings you have chosen. This allows you to directly compare their performance.
You can adjust the incrementality settings for each row, but remember that this is strictly for exploratory purposes and your action will not be saved or affect your incrementality model. If you have questions about adjusting your model based on changing settings, reach out to your client success partner.
You can also export this table in multiple formats by clicking Export at the upper right. This allows you to share this data with other stakeholders as necessary.