XCD: Using the Cross-Channel Dashboard

Getting Started
The Cross-Channel Dashboard (XCD) shows the performance of all of your marketing and transaction integrations, calibrated by your Measured Incrementality Model (MIM). That calibration provides incrementality metrics for both your business as a whole as well as your individual channels and tactics.
Uses for this dashboard include:
- Understanding and managing how you spend on marketing
- Making better budget decisions for your channels and tactics
- Seeing what metrics marketing platforms are over or under-reporting
- Finding new opportunities to explore and invest in
If you’d like clarification on the terms and acronyms you see throughout the dashboard, see our Product Glossary article.
>
What Is the Cross-Channel Dashboard?
The XCD provides a snapshot of your overall business, as well as incremental metrics for your channels and tactics. These are the more accurate versions of what other platforms may be over or under-reporting, as discovered by your MIM.
For example, a tactic’s ROAS that a platform reports as being very low may actually be doing much better when incrementality is applied to it. This would mean it’s worth increasing your spending there, or even launching a geo test to explore it further.
Alternatively, if your platform was reporting ROAS as being high but your incrementality metrics were telling you otherwise, you would know it may be worth scaling spending back. Then, you can use that part of your budget elsewhere.
How Does the Cross-Channel Dashboard Work?
The XCD is powered by taking what your integrated platforms have reported to you and calibrating that data with your specific media mix model, which is a key feature of your MIM.
Within Measured, campaigns with similar goals from a single ad platform are grouped into tactics. Single campaigns may not provide enough data to draw conclusions, so this grouping ensures that the strength of your marketing can be accurately determined.
The data from your ad platforms is then calibrated by your geo tests and your media mix model to provide an incrementality adjustment factor for each of your tactics — this is the portion of reported conversions that were actually driven by your media spending.
Getting to Know the Layout
Various settings are available within your dashboard to let you specify your XCD data. Adjust them to focus on specific channels, tactics, and time periods.
Global Filters
Along the top of the page, there are global filters that will affect metrics shown across the entire dashboard.

- Time Period lets you set the date range for the data you'll see. This date range will determine further filtering options based on what was present during that time.
If Compare is enabled, you will be able to hover over metrics throughout the dashboard and see how they have changed over time and why. The contributing factors will be listed in order of having the most impact on the change.
Like with your selected time period, be aware that selections in the filters below will affect the options provided in successive filters.
- Conversion Type lets you choose between viewing all of your business’s conversions or only specific kinds.
- Channel shows all of your channels by default but can be used to only show the ones you choose.
- Segments lets you decide which part of the marketing funnel you want your reporting to represent.
- Tactics lets you select certain tactics to analyze, which are groups of campaigns with similar strategies.
- Campaign lets you narrow down which campaigns you would like to view data for.
Portfolio-Level Metrics
After setting the global filters, the first reporting data you will see are the overall metrics for your selected criteria.
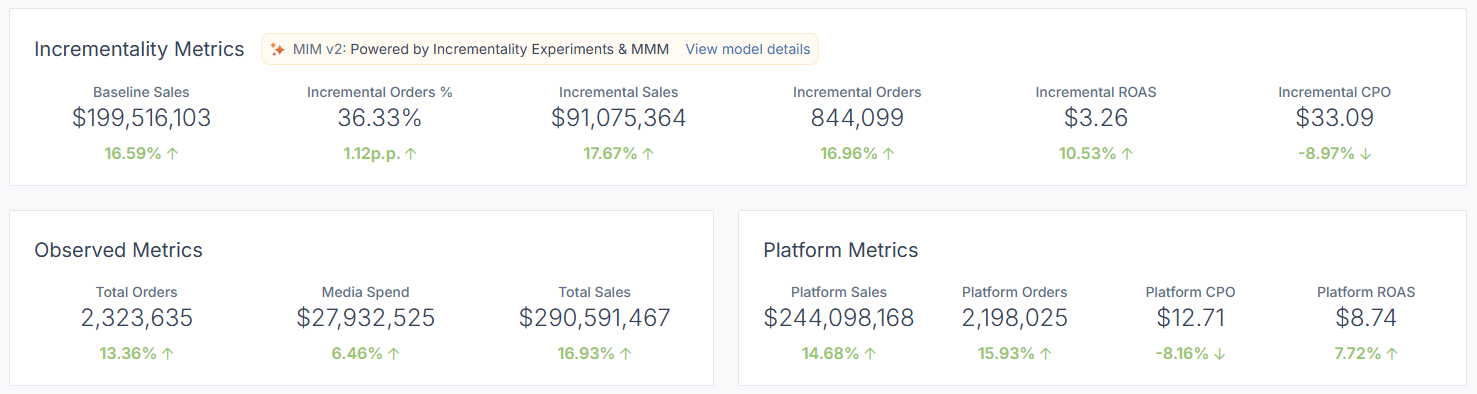
- Incremental metrics show the true results of your performance. The most important takeaways here are your end results, such as Incremental ROAS and CPO.
The incrementality percentage by itself is neither good nor bad — the best gauge of your performance will be your end metrics which represent your bottom line. - Observed metrics represent the data we pull from your transaction data systems and ad accounts.
- Platform metrics show the figures your media platforms are reporting. Those platforms tend to over or under-report performance since their attribution models are based on what might have happened instead of what actually happened.
Platform metrics stand in direct comparison to your incremental metrics, which are more accurate.
Your MIM Performance
If you click View model details within the golden MIM banner at the top of the portfolio-level metrics, you will be taken to a snapshot of your model's output.
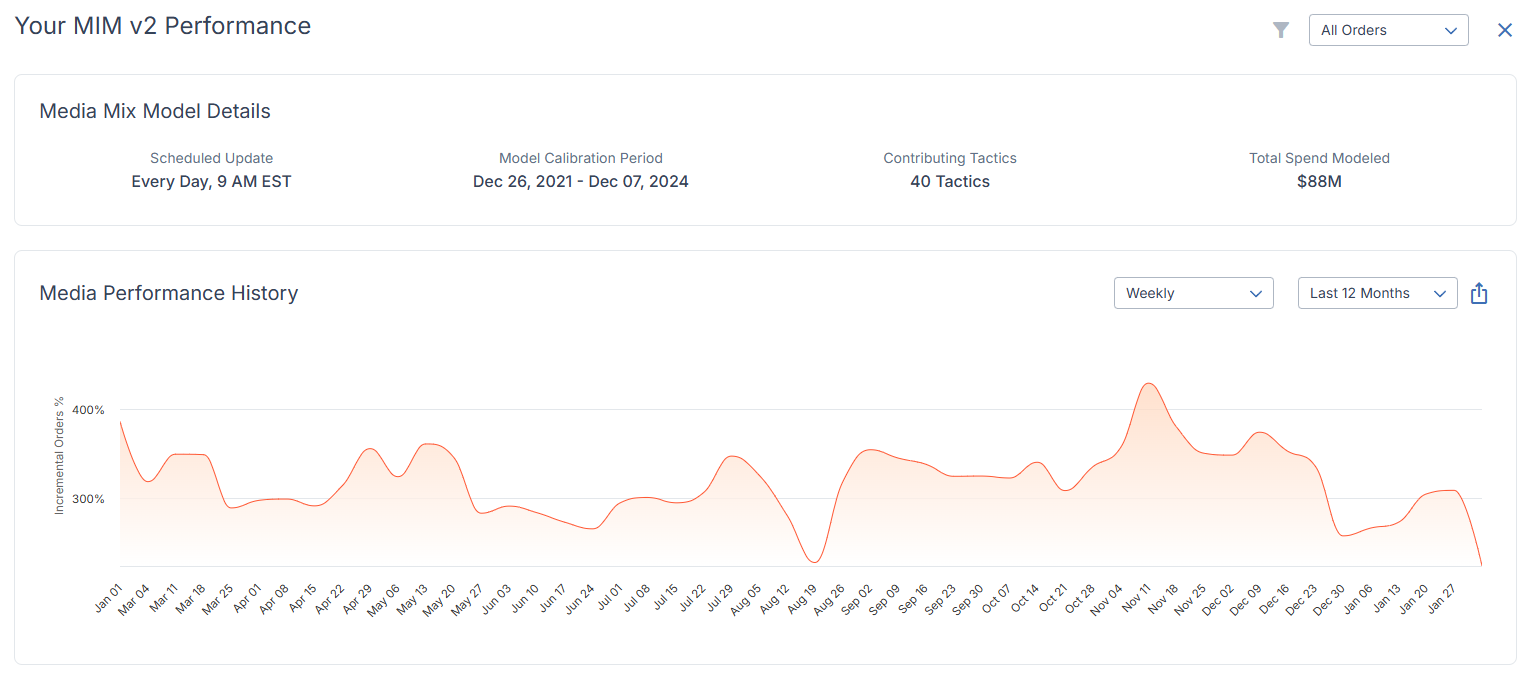
At the top of this screen, you will see details on the previous 3-year period that your model is calibrated on, how many of your tactics are contributing to it, and how much your spending has been modeled based on those factors.
The chart below presents this information visually. You can hover over a given point on it to see the incremental measurement of your chosen conversion type on that specific date.
The bottom of the page gives details on your any of your tests and tactics that are contributing to your model performance.
Performance Over Time
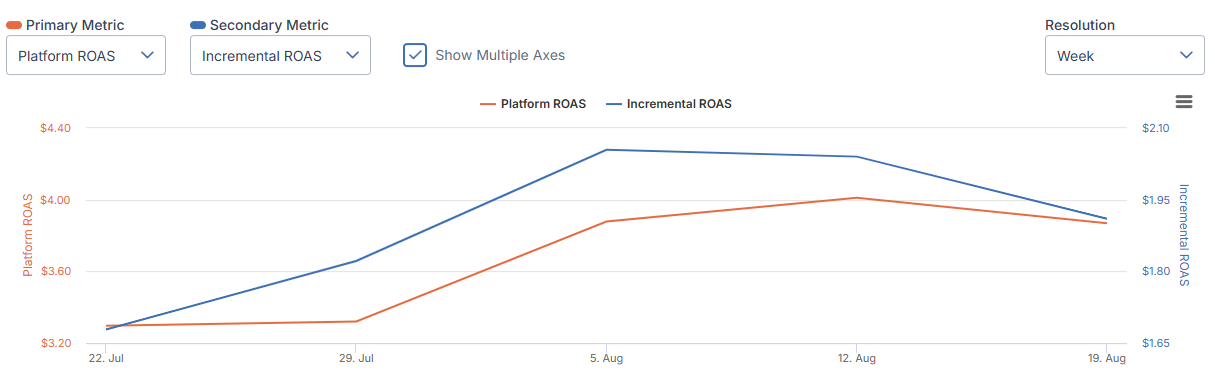
The Performance Over Time chart lets you compare two metrics over your chosen date range. This is useful for placing an incremental metric against what was reported by the ad platform to see what has been over or under-reported.
If the metrics you are comparing are measured by different dimensions, click Show Multiple Axes to incorporate both into the graph. The appropriate scales will then appear on either end of the graph, color-coded to their line.
Summary Table
At the bottom of your XCD page, you’ll see all of the factors that contribute to your hero metrics listed in a table.
Different categories of data will be available as tabs across the top of the table. Remember, these options will be dependent on what you have selected in the global filters at the top of the page.
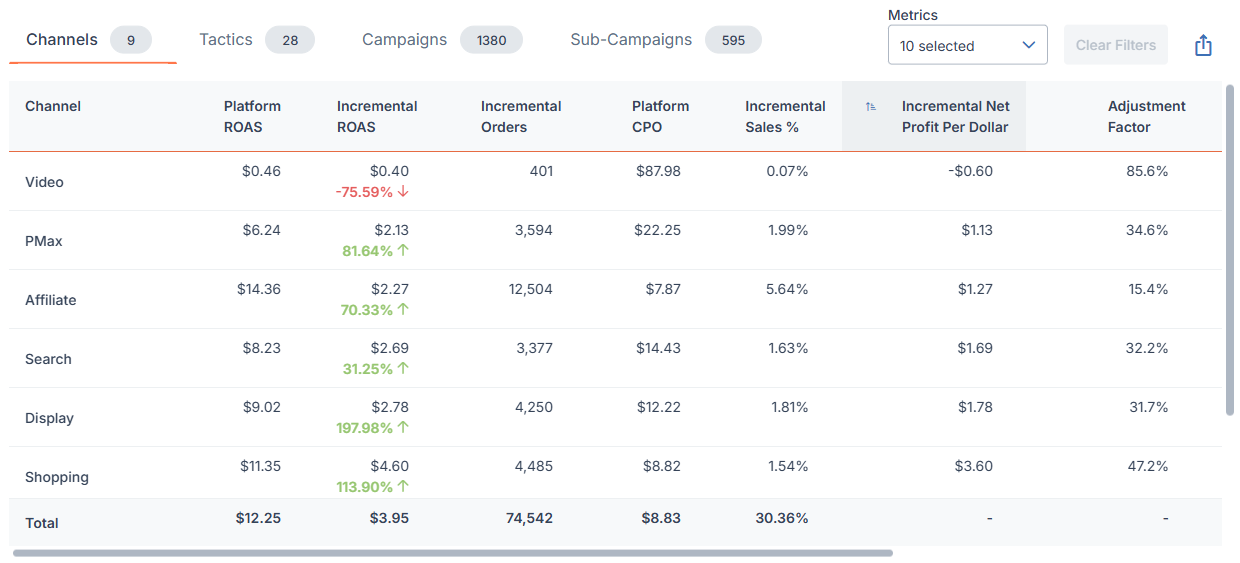
Channel, Tactic, Campaign, and Sub-Campaign will all display their respective data type within the table. For all of these, if there they stem from a prior category, it will be listed on the row below.
You can customize the table's columns by clicking the Metrics drop-down to add or remove items. Unique options are present for this table, like impression and click conversion rates. Clear Filters will revert the table to its default.
Export allows you to download the table as you have set it up in one of multiple spreadsheet formats.
In-Depth View
Under the Channels or Tactics tabs of the Summary Table, you can click on the name of listed items to be taken to an in-depth view of its specific performance.
The in-depth view has multiple tabs to switch between:
- The Summary tab will show valuable analysis, like what has led to its current incremental ROAS. You will also see available tests, industry benchmarks, and how to optimize it within your budget to get the best return.
- The Metrics tab shows contextual metrics which contributed to its performance.
- The Tactics tab (or Campaigns tab for a tactic) show related items contained within the item you are analyzing.
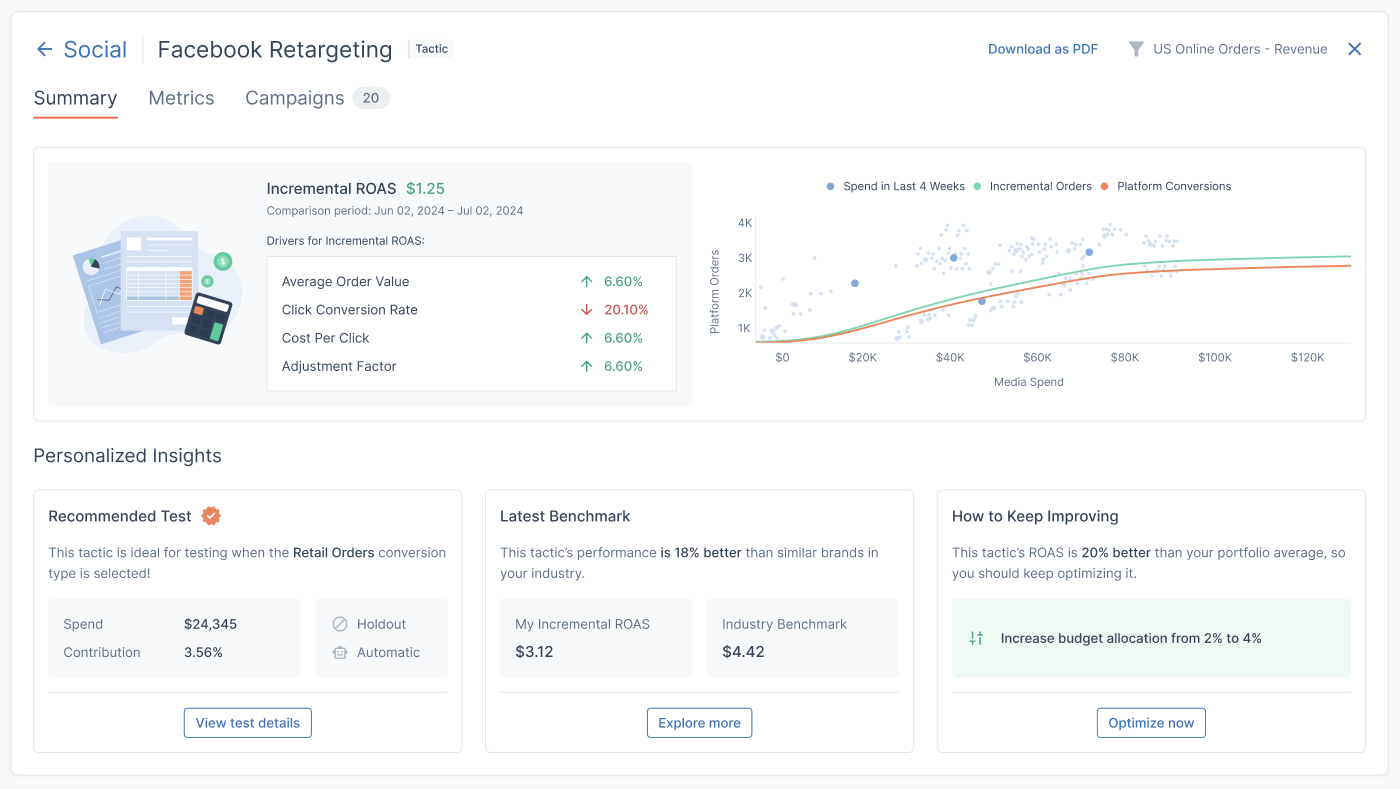
If your account has the most recent version of the Measured Incrementality Model, the in-depth view for a tactic will contain all of those metrics as well as a line graph. This visual breakdown lets you chart the relationship between spending on the tactic and the platform-reported orders that spending has led to.
The data in the graph is based on the past three years of your order history, and your incremental orders (represented as the green line) are found by applying the tactic’s adjustment factor to what your integrated platform initially reported.