Geo Tests: Reading Your Results

Getting Started
After your geo test has completed and your results have been finalized, you’ll get comprehensive results detailing all of the test’s findings.
This article covers interpreting your geo test results.
Click here to read about the concepts and terms involved with geo testing.
Click here for how-to instructions on setting up your own geo test.
Accessing Your Results
When your test’s results are ready, you can view them by going to My Tests section in the bottom of the main Geo Tests page and clicking the Finished tab.
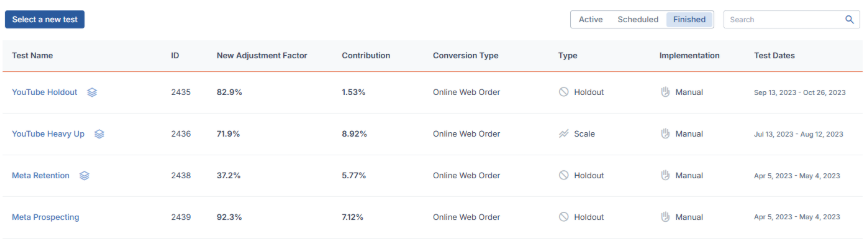
Here, you will see an archive of all of your completed geo tests, alongside high-level details. Clicking the test’s name will take you to that test’s results.
Note: If your test has ended but the results are still being processed, it will still appear under the Active tab with the label Results Pending.
Test results can also be downloaded as a PDF via the link at the bottom-right of any test's results page.
Results Overview
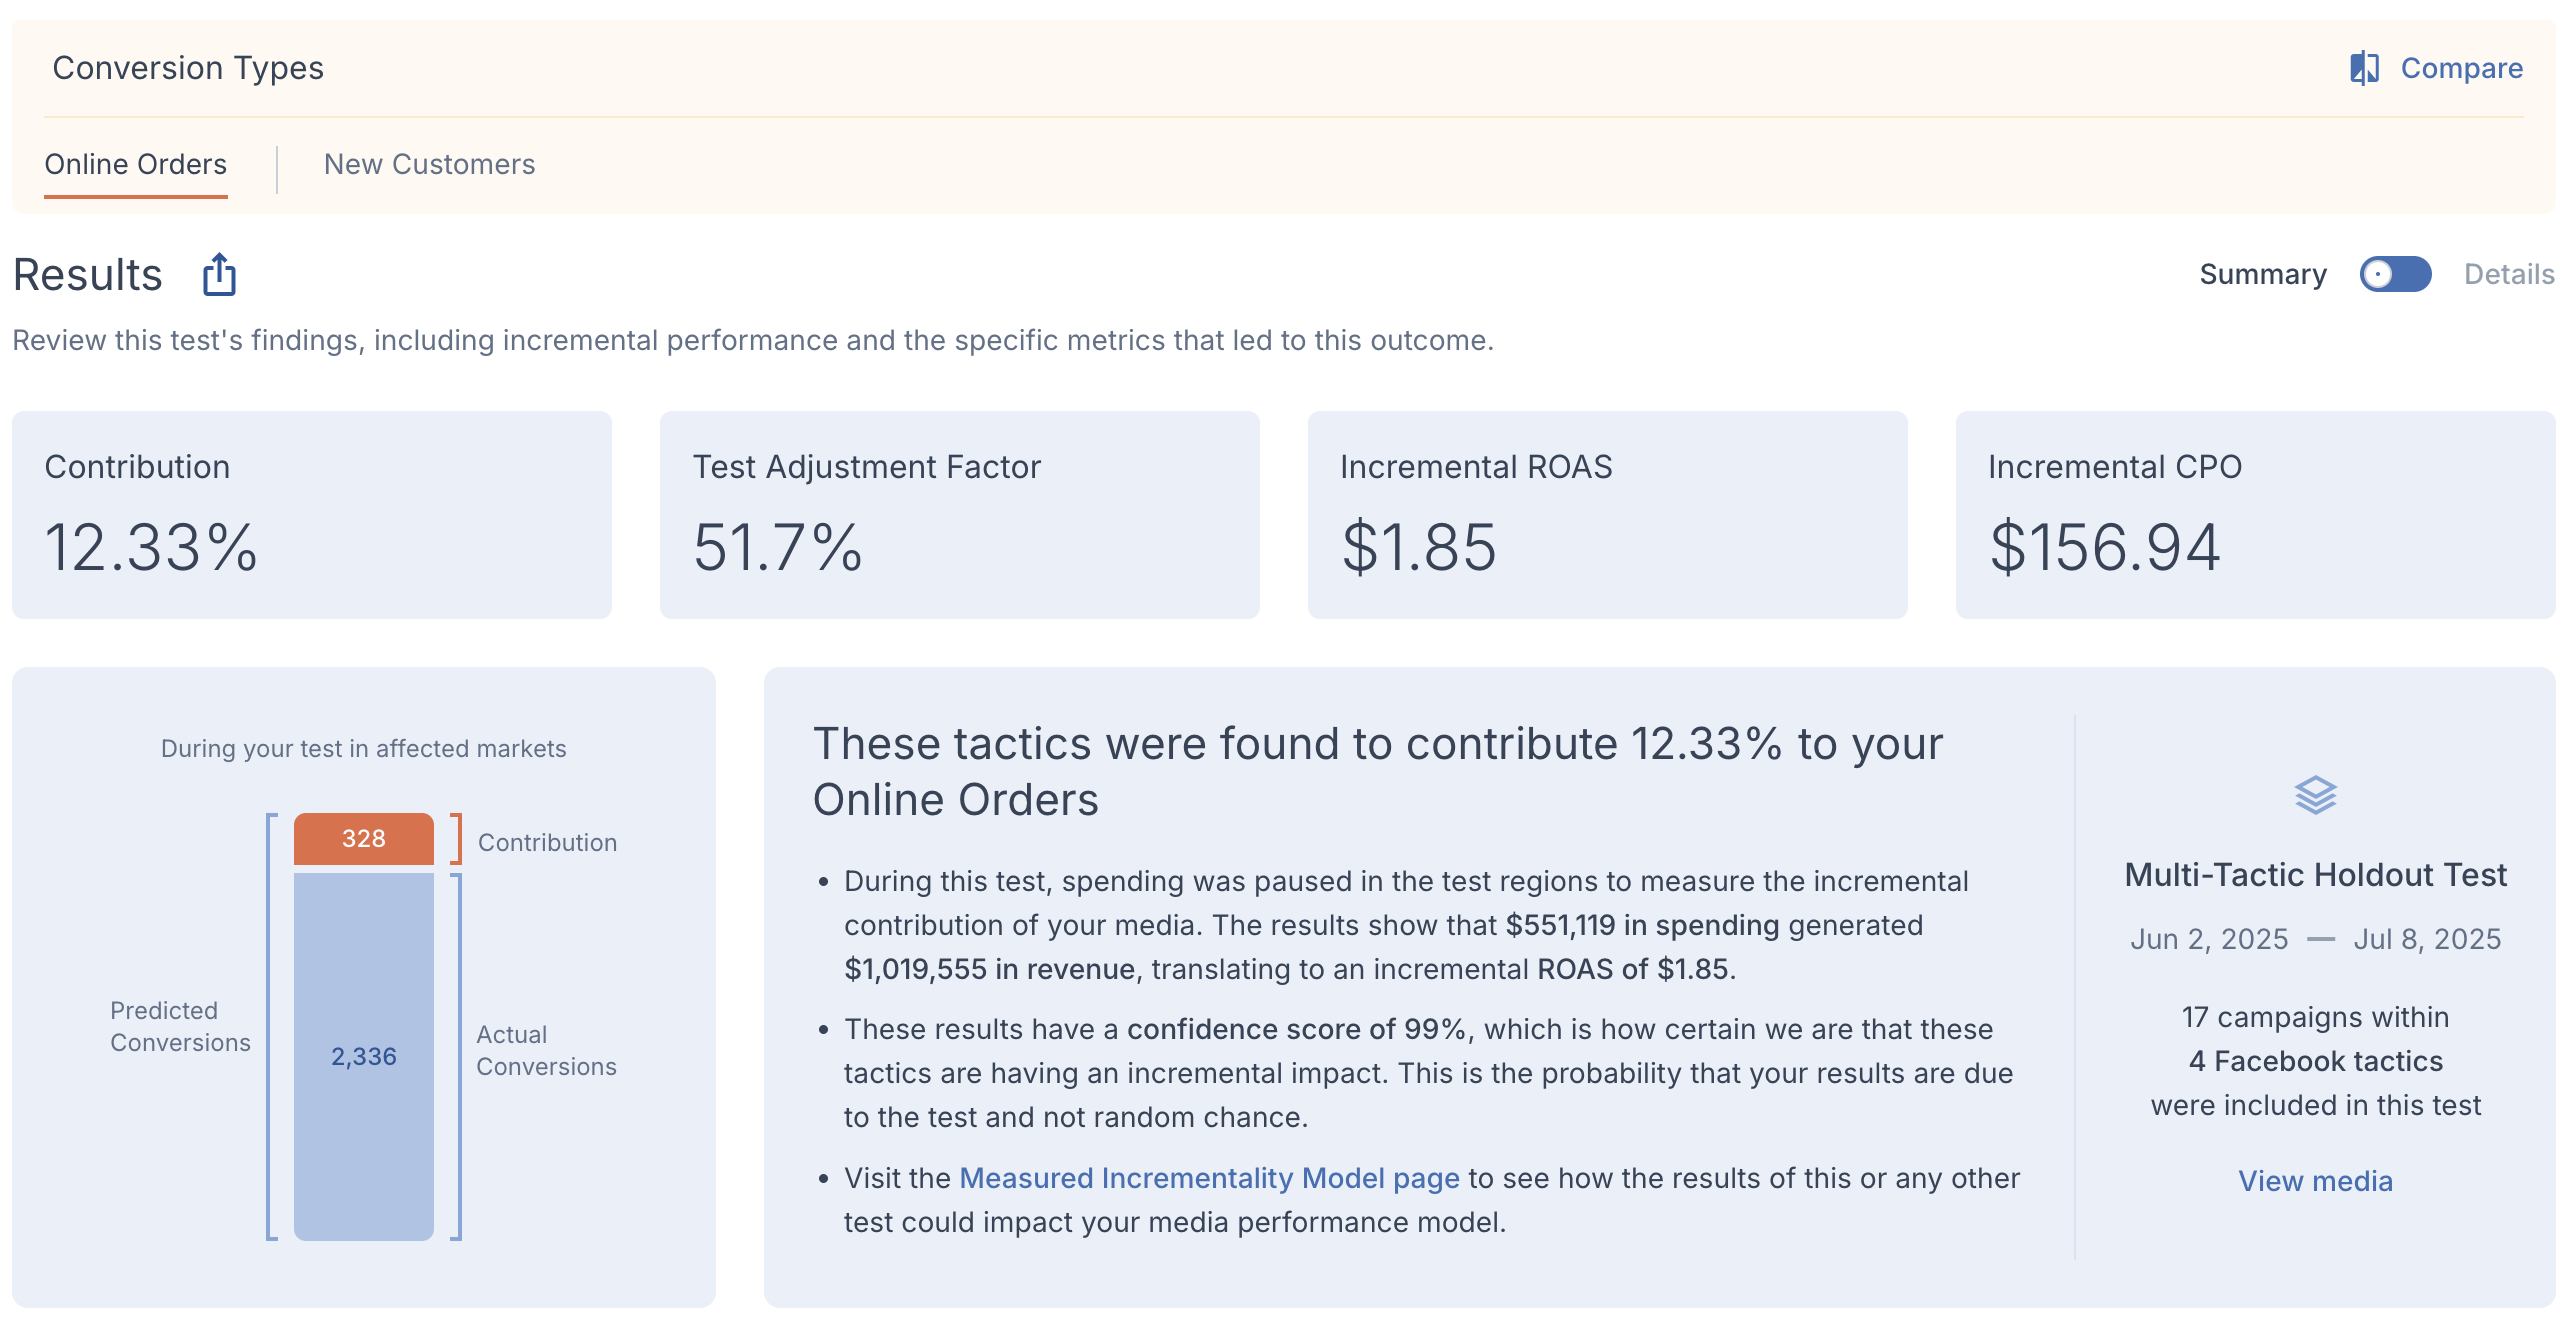
The top section of your results page will show an overview of the test’s findings. An explanation of how any metrics seen here are calculated can be found in the Metric Calculation section of this article.
If your test covered multiple conversion types, you can switch between their individual results via the tabs above the results summary. You can also see the results for these types side-by-side by clicking Compare in the upper-right corner of that section.
Summary Metrics
The metrics you see at the top of the Results section are key takeaways found in your test’s outcome.
- Contribution is how much your tested media was found to contribute to the tested KPI during the test’s duration.
- Test Adjustment Factor is the percent of conversions from the test that were found to be incremental.
- Incremental ROAS and CPO are the key financial metrics this test found regarding your media’s true performance.
Predicted vs Actual Chart
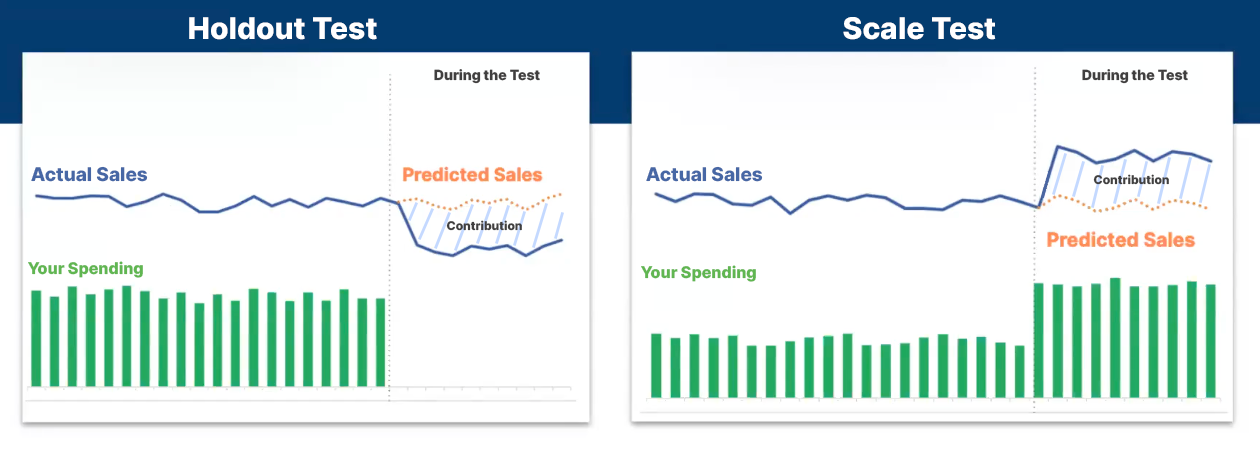
A chart will visually display the test’s findings. This will differ between holdout and scale tests, but both will show some combination of predicted, actual, and net conversions. The predictions are based on the last two years of conversion patterns for the initial markets your test was modeled on.
- For holdout tests, the total bar will reflect our initial prediction of how many conversions would have occurred if your media had not been withheld. Actual conversions are what happened during the test and net conversions represent the difference between the predicted and actual conversions.
- For scale tests, the total bar will represent how many conversions actually took place, with net conversions showing conversions that only occurred due to the increased budget you employed for test purposes.
Executive Summary
This section provides a brief narrative on what happened during your test and how the results can be applied, with the broad parameters of the test shown in the section on the right.
- The title in the summary is the main takeaway regarding the performance of your tactics found during the test.
- The first bullet point describes the basic mechanism behind the test, how that applied to your media spending, and what its outcome was.
- The second bullet point gives the test’s confidence score and explains what that means.
- The third bullet point links to your MIM page so your results can be applied to your brand’s model if they are applicable.
Details View
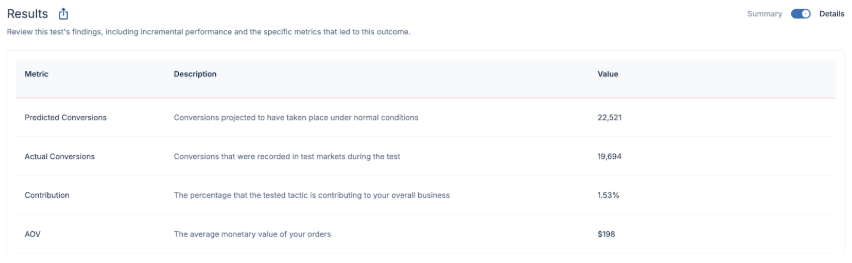
At the top of the Results Overview section, a toggle is available to switch from the default Summary view to a Details view instead. This will lay out the metrics for both test inputs and results in table form, along with a definition for each of them.
Expert Notes
Below the test findings, you will see a section where your customer success partner can leave specific notes and insights regarding your results. Admin-level users on your account can also leave notes in this section.
How It Works
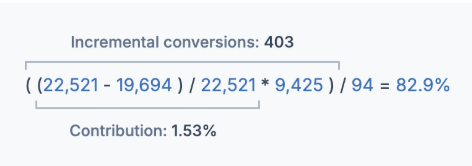
Clicking How it works at the bottom of the page gives a thorough breakdown of how the metrics in your summary were calculated.
A formula will be displayed containing the metrics that led to your test adjustment factor. You can hover over any of the numbers in this equation to see their definition and learn more about them in the Metric Calculations section.
You will also see a visual breakdown of how the predicted conversions we modeled had lined up with your actual conversions in the year preceding the test. You can interact with the graph by hovering over a point to see the conversions from that time period.
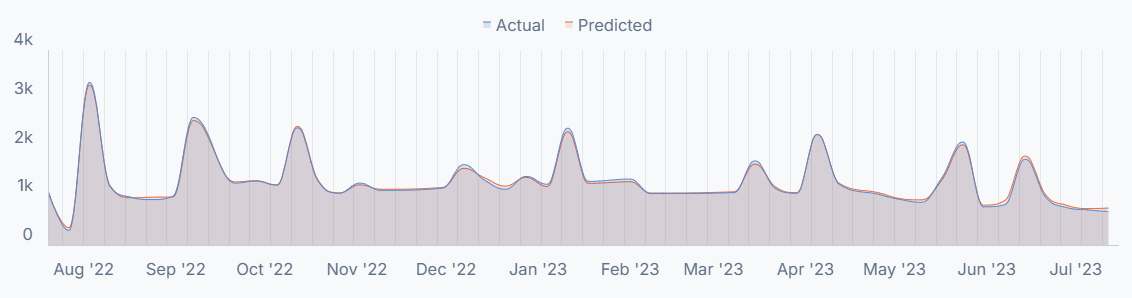
Note: You may notice that the difference between the actual and predicted lines in the graph is very small. The closeness of those lines reflects the high accuracy of your model.
Metric Calculations
This section will dive into the various metrics seen in your test results and how they were determined.
Contribution & Test Adjustment Factor
Contribution is the percentage that your media was found to contribute to the KPI in your test over its duration. This leads to a test adjustment factor, which is specific to your test’s timeframe and conditions but may be used to update the accuracy of the main adjustment factor seen in places like your Cross-Channel Dashboard.
- First, contribution is determined as a percentage by taking the number of orders initially predicted in test markets, then adding or subtracting the actual orders the test observed. That result is then divided by the initial number predicted in test markets.
- Then, incremental conversions are calculated. For holdout tests, this is found by multiplying the total actual conversions across untested markets by the established contribution percentage. For scale tests, this is found by subtracting the actual conversions by the predicted conversions.
- Finally, the test adjustment factor is determined. For holdout tests, this is determined by dividing the incremental conversions by the vendor conversions across untested markets. For scale tests, this is determined by dividing the incremental conversions by platform-reported marginal conversions.
Since the test markets are precisely matched with similar markets where test conditions weren't implemented, we know the contribution in your results is representative of these untested markets as well.
In most cases, you'll see incrementality below 100%, meaning your integrated platform has over-reported your true number of conversions. If it is above 100%, the platform is instead under-reporting.
Incremental ROAS & CPO
These are the incremental versions of your KPIs, found by applying the test adjustment factor to your spending during the test. The precise calculations behind these are as follows:
- Incremental ROAS is the incremental conversions from your test multiplied by your order average order value. That number is then divided by the withheld spending (holdout) or additional spending (scale) during the test.
- Incremental CPO is your ad spending during your test divided by your incremental conversions.
Confidence Scores
The confidence score in your test results measures how likely it is that the outcome is attributed to test conditions and not random chance. Generally, higher levels come from tests that show the tactic having a high contribution to overall business on a consistent, week-by-week basis during the test.
Measured combines multiple factors to consistently achieve high confidence scores in test results:
- Industry-leading market selection modeling
- Accurate inputs from your business's MIM
- Pre-verified test designs
Those elements allow for accurate testing in as little as 10-20% of the country, so high confidence tests can be run without a significant disruption to your business.
Calculating Confidence
Measured uses industry-standard methods to find your test's confidence level. For any test, there are initially two different scenarios that are run against each other:
- A baseline (a.k.a. null) hypothesis that assumes there will be no change from normal business during the test
- A positive (a.k.a. alternate) hypothesis that assumes test conditions will cause a decrease in the number of conversions for holdout tests, or an increase in the number of conversions for scale tests
The goal is to prove the baseline hypothesis wrong. For each test, our platform reports the probability that the observed results would still happen under baseline conditions. The lower that probability is, the less likely the results are due to random chance.
The confidence level you see with your results is calculated as 1 minus that probability level. For instance, if a 3% probability was found that your results would still have occurred without the test, it would be 1 minus 3%, or a confidence level of 97%.