MIM: Using Your MIM Page

Getting Started
The Measured Incrementality Model page shows you details into the engine that powers the insights into your media performance throughout your account. Uses for this page include:
- Comparing your current incremental metrics with their latest model results
- Seeing a preview of how those metrics will change with your next reporting update
Reporting Updates
Your model is updated on a daily basis, as detailed in the main MIM article. However, the rate at which the model’s output is applied to the reporting you see within Measured is entirely up to you.
Clicking Edit schedule within the banner along the top of the screen will provide you with various options.
You can choose the cadence at which your model results will be applied to your reporting.
- Unscheduled will let you apply updates on an ad hoc basis. They will not occur automatically and you will need to select Manual Update on the main page to apply new model results when you deem fit.
- Weekly, Monthly, and Quarterly set an automatic cadence for your reporting updates.
Next Update will give you the date when your model results will next be applied if you have chosen a scheduled option.
Historical Data Range lets you decide the past period of adjustment factors that will be overwritten with new data by the next update.
Filtering Options
Along the top of the screen, there are options for what will be displayed across the entirety of the page.
- Compare with lets you set the date range that will be used as a point of comparison through the page
- ROAS/CPO lets you decide which end metric your tactic activity will be shown in relation to
- Conversion Type will let you select one of the types within your account to serve as a framework for the data you see
- Segments, channels, and tactics let you filter the metrics seen throughout the page by those items
- Latest results and Selected period let you switch between seeing only the most recent model results and seeing an aggregated view of the results from the timeframe you selected at the far-left of the row.
The Results Preview Tab
Portfolio and tactic-level information on your model’s output will be shown below the filtering options. In addition to the most recent metrics, you will also see an update preview.
Though your MIM updates on a daily basis, its output will not be applied to your data until a reporting update occurs. The update previews you see throughout this page indicate how the metric is set to change upon your next scheduled reporting update.
Reasons your new results may be different include:
- Daily updates to your model that have not yet been applied
- Recent geo test results that have impacted your model
- Changes to how your campaigns are mapped into tactics
The cadence of your reporting updates is set to your preference by your customer success partner. Consult them if you wish to adjust or have any questions about how often your reporting updates.
Portfolio
The Portfolio section provides a broad overview of your total performance in terms of incremental metrics, including ROAS and how much your media is contributing to your business’s overall revenue.
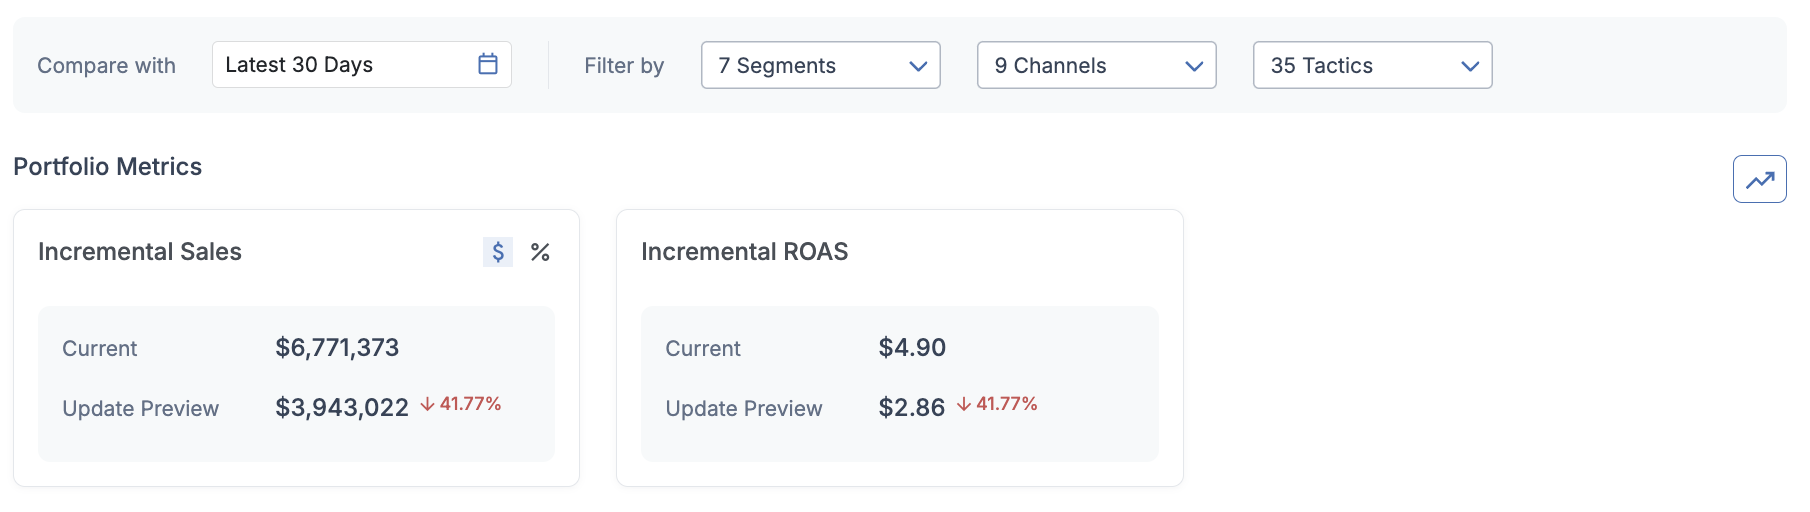
You will see the most recent reported metric alongside a preview of how it will change on the next update. The amount of this change can be viewed as either a dollar amount or a percentage by switching via the appropriate icons.
By clicking the chart icon at the top-right of this section, you will unfold an Incrementality Trends chart.
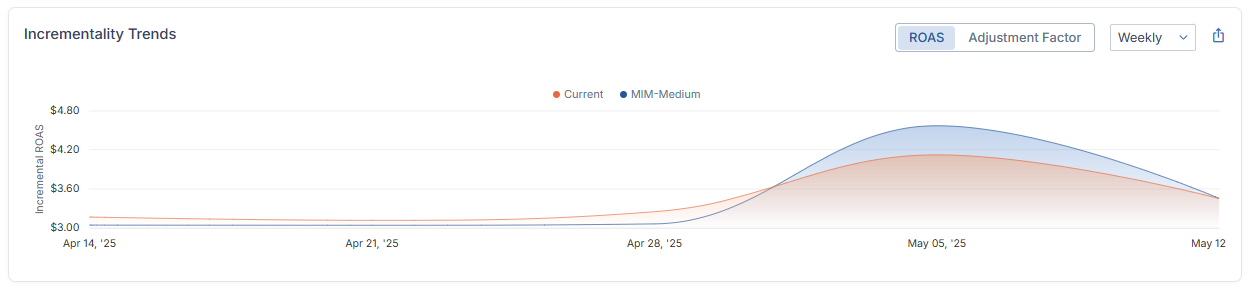
This chart displays the metric you have selected in the upper-right corner at your chosen time interval. It shows how that metric compares to your model’s output from that same time.
Tactics
At the bottom of the screen, you will see a list of all of the tactics that are covered by your chosen filtering options. This information is exportable via the export icon at the top-right of the table.
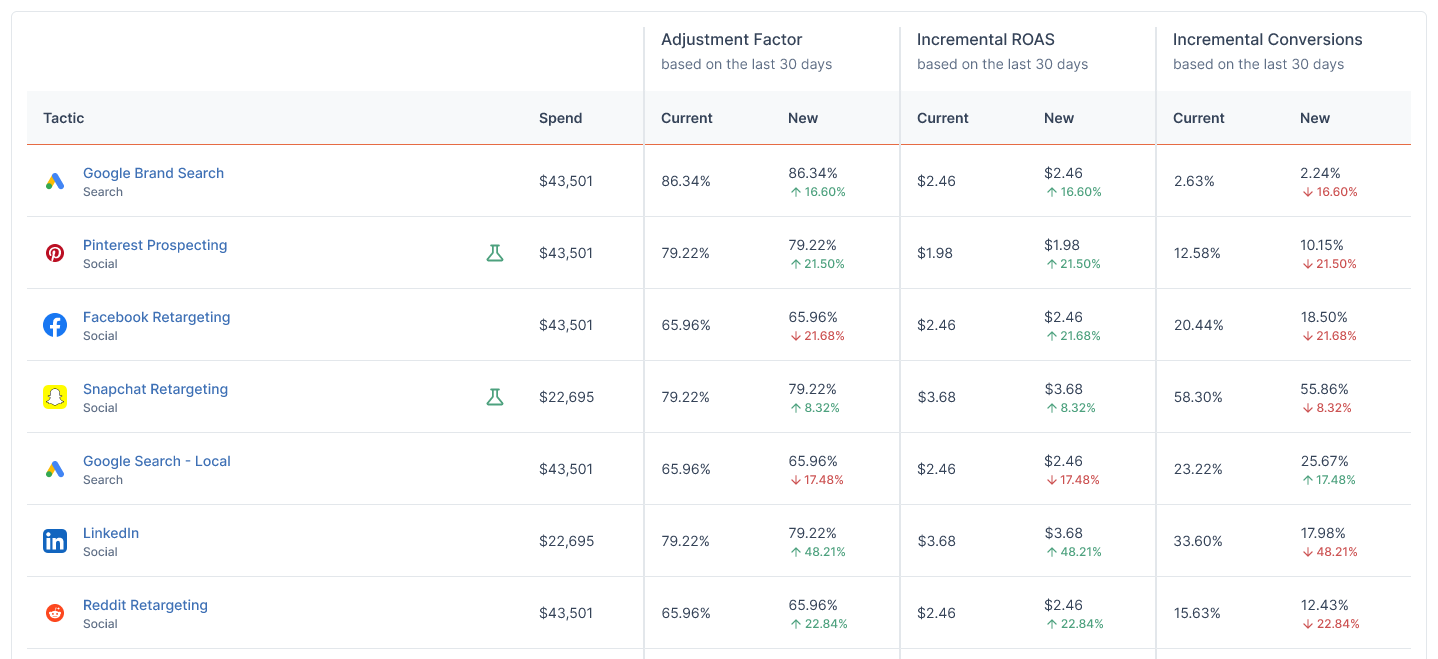
For each listed tactic, you will see its most recent reported spending amount, followed by its adjustment factor, incremental ROAS, and incremental conversions. For those three metrics, you will see both the current version and a preview of how they will change if your reporting updates were applied today.
The Model Tab
Clicking Model at the top of the screen will show you the tests and tactics that are contributing to your model.
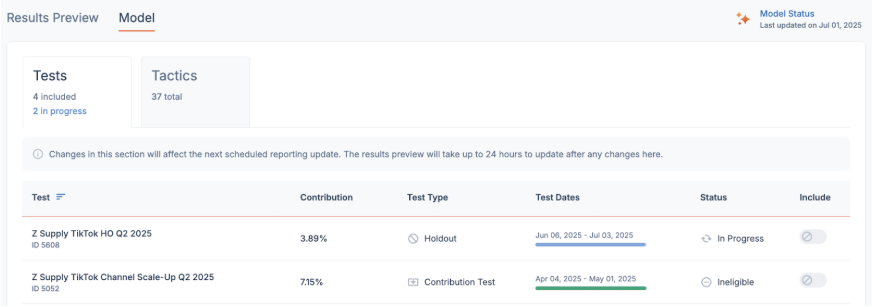
Tests
The Tests screen will show all of the tests you have run within Measured that are either in progress or completed. You will see important details such as the type of test, its contribution, and the dates during which it ran.
You will also see whether or not a test is eligible for affecting your model. (Currently, this is limited to holdout tests.) If a test is marked as ineligible, hovering over that status will show you details as to why it cannot be included in your model.
If you would like to change whether an eligible test is included or excluded from your model, contact your customer success partner for assistance.
Tactics
The Tactics screen will list all of the tactics that you have created within Measured. You can see the type of input (spend or orders) being used for this tactic in your model, as well as the last time data was received for it.
You will also see whether the latest results are available. If so, you can visit your Results Preview screen to see how their metrics will change the next time your reporting is updated. If they are not available, hovering over the status will give you details.