Optimization Report: Concepts and Overview

Getting Started
The Optimization Report is a high-level view of your recent marketing performance. It shows the revenue you made by adjusting how you spent your marketing budget in a given timeframe.
Uses for this include:
- Seeing one simple metric to gauge your performance by
- Assessing the performance of previous time periods
- Getting guidance on how to adjust your marketing budget
- Sharing an easy-to-read report with other stakeholders
How the Report Works
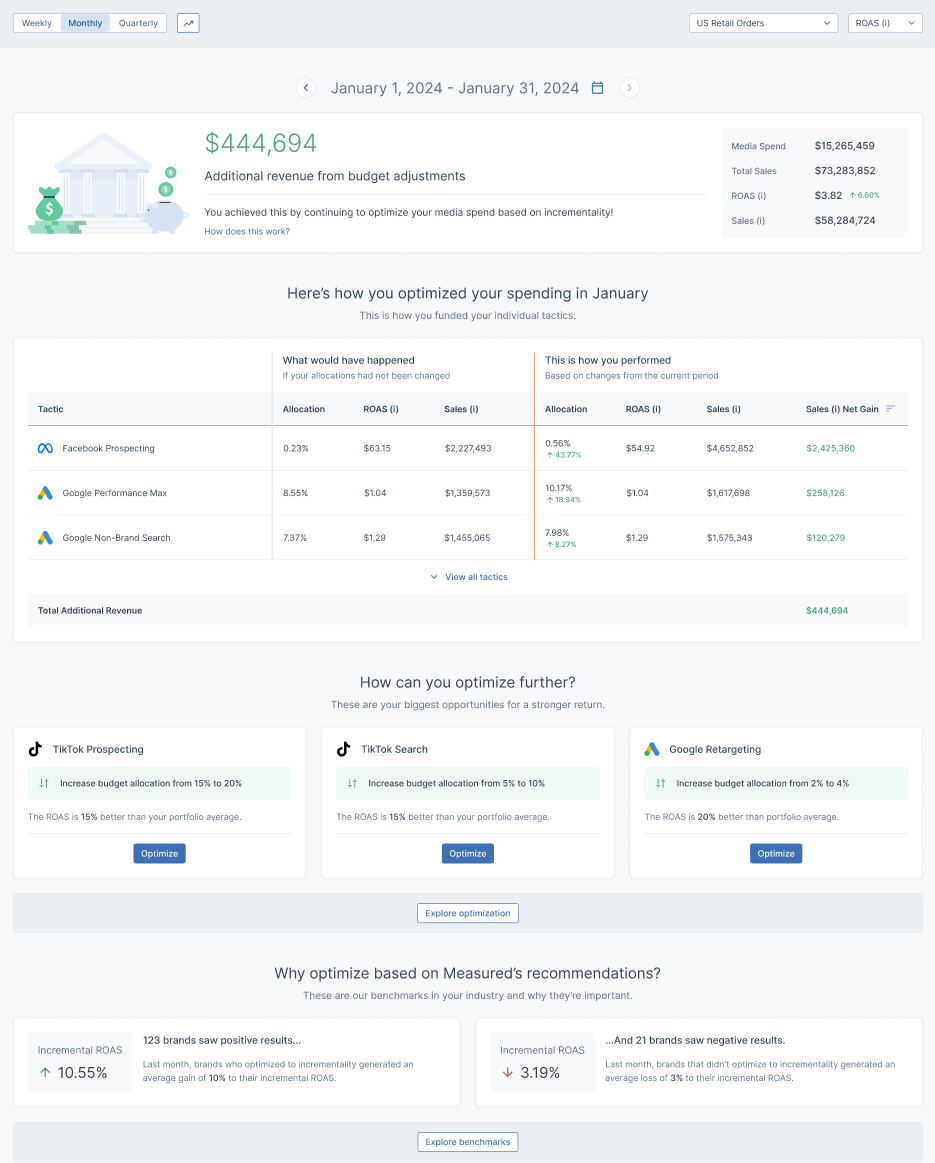
The key metric on your Optimization Reported is the additional revenue you made during your chosen time period. This amount is based on any budget adjustments you had made — because you took money out of one tactic and used it elsewhere, this is what happened to your overall revenue.
This is found by comparing your actual revenue to your projected revenue in a hypothetical scenario.
- Your actual revenue is found by observing your revenue that occurred during the given time period, complete with any budget adjustments you had made.
- Your projected revenue is found by supposing that no budget adjustments had occurred and that your budget had the same spending allocations as the previous period.
The additional revenue shown in your report is the actual revenue from that period minus the projected revenue that would have happened if no budget adjustments had been made.
Many Measured features offer suggestions for how to best allocate your marketing budget. If you have been following them, then the additional revenue you see in this report is an easy way to see the value you are receiving from using Measured.
Configuring the Report
The Optimization Report is initially based on the default plan in the Media Plan Optimizer (MPO), though you can reconfigure this at any time.
In MPO's default plan, all of your non-scalable tactics (i.e. retargeting, email, etc.) are set as Optimized (Capped). This means that we will not recommend increases to them in your budget plans, though decreases are possible if we see them underperform.
If you would like to change these settings and how they calculate your Optimization Report results, take the following steps:
- Navigate to MPO in your Measured account, under the Optimize tab in your main navigation bar.
- Customize any plan's tactic allocation settings or adjustment factors as you see fit.
- Save the plan you just customized as your default plan. It will now be used for the calculations in your Optimization Report.
If you make any changes in MPO, here are some important things to take note of:
- Changing a tactic's setting from Optimized to Optimized (Capped) will mean the tactic will not be increased beyond a certain value in the Optimization Report.
- Changing a tactic's setting from Optimized to Anchor will mean Optimization Report will only use the value you set yourself.
- Alternatively, if a tactic is changed from either the Optimized (Capped) or Anchor settings to Optimized, the Optimization Report will freely show what could have been different at ideal spend levels.
- If a tactic's adjustment factor is changed in the default MPO plan, it will also be used in the Optimization Report. For example, if a tactic is showing very high performance, you can edit its adjustment factor in the default MPO plan to make it more realistic.
Getting to Know the Layout
The page will be divided into a few different sections, as seen below.
Global Filters
At the top of the Optimization Report, you will see options for the information it will display.
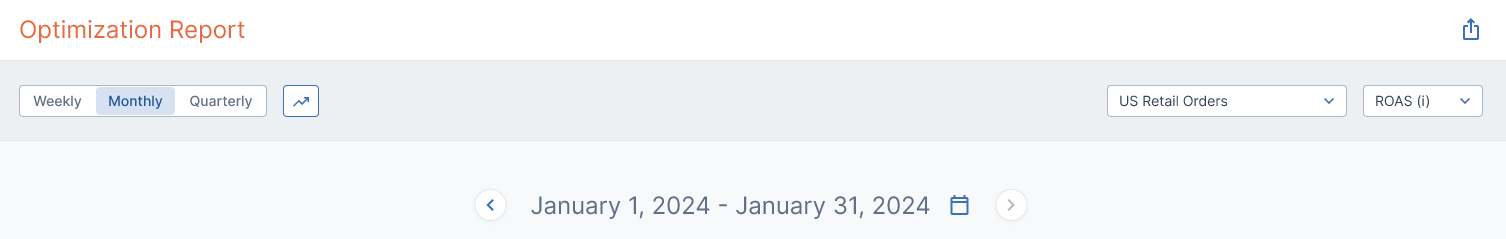
In the upper-left corner, you can:
- Switch between displaying reported data as weekly, monthly, or quarterly.
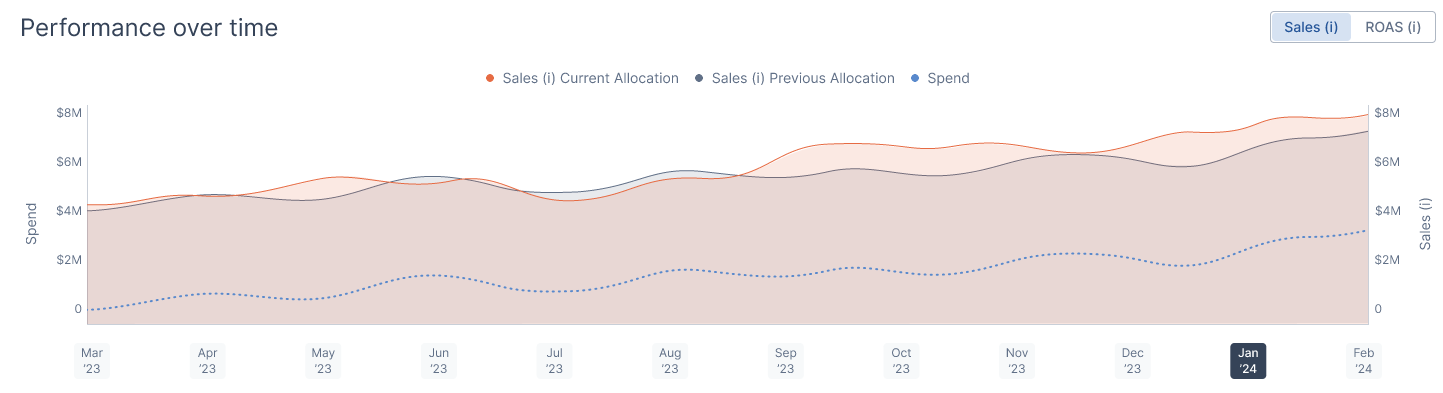
- Click the trending arrow button to unfold a Performance Over Time graph that will show how your spending has compared to incremental sales and ROAS metrics over the previous months.
In the upper-right corner, you can:
- Choose which order type you would like the page’s data to be based on.
- Select ROAS (i) or CPO (i) as the report’s primary metric.
- Click the export icon to download your report as a separate file to share with stakeholders.
Below those, you’ll see the date range for the reported data. This will be responsive to the unit of time you chose in the upper-left. Use the arrows to either side of the date range to cycle through previous timeframes, or click the calendar icon to immediately go to a specific one.
Revenue Summary
The first metric on the page shows how much revenue you have made in the chosen time period due to changes in your budget allocations. This is the key takeaway from the Optimization Report.

More financial metrics from the time period are shown to the right. These offer additional information regarding what you spent and the return you received.
Performance by Tactic
Next, you’ll see a list of your tactics. They will be shown in descending order by how much their incremental sales increased during the time period. The top three will be shown by default, though the list can be expanded to show more tactics.
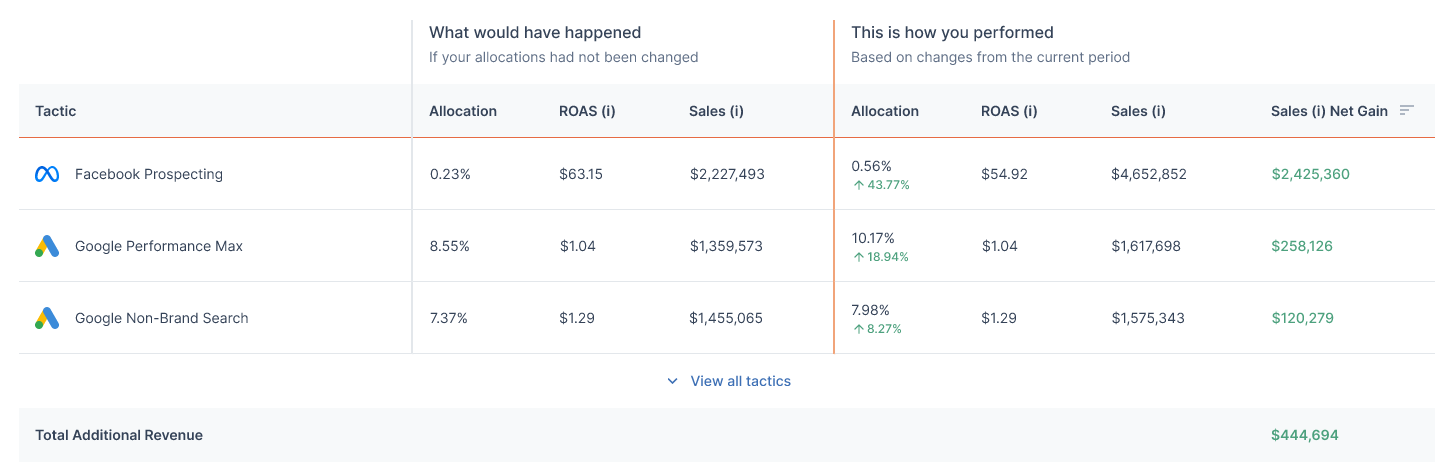
This section illustrates the hypothetical scenario that the report is based around.
- The first section of metrics show your projected revenue, or what would have happened if your budget allocations had not changed.
- The next section shows your actual performance, including the changes in incremental sales due to your budget adjustments.
You can see the total increase to your incremental sales at the bottom right of the section. This becomes the additional revenue that is listed at the top of the report.
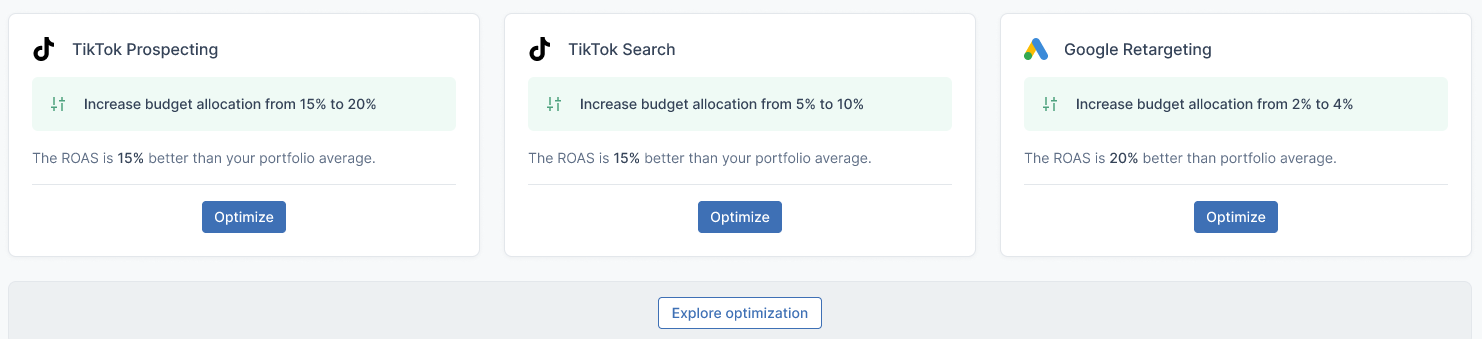
Further Optimizations
Your report will contain recommendations based on the performance of your tactics. These are surefire ways to continue to increase your additional revenue by spending your budget more efficiently.
Clicking Optimize or Explore optimization will take you to the Media Plan Optimizer, where you can implement these suggestions in a new or existing budget plan.
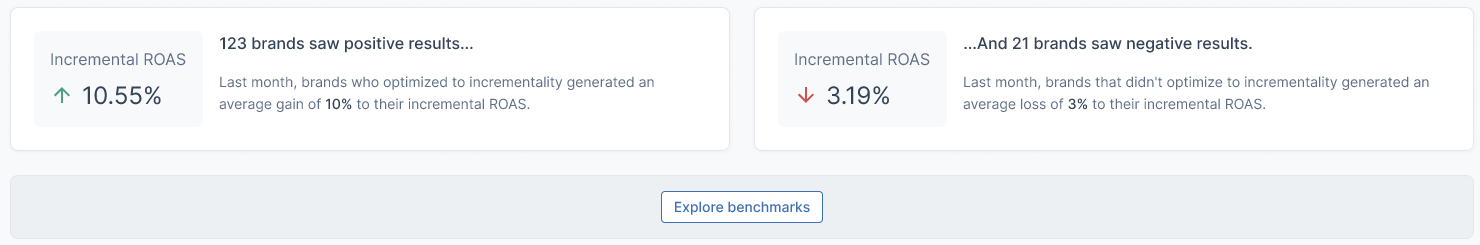
Benchmarks
The bottom section speaks to the benefits of using the Optimization Report and recommendations for adjusting your budget. These benchmarks for optimization show how effective taking Measured’s suggestions can be.
Clicking Explore benchmarks will take you to your Benchmarks page, where you can see how your business’s metrics line up with all other Measured brands, or just those in your specific industry.
FAQs
Why can’t I compare two periods which directly precede or follow each other?
Having more time between the periods the report compares means that more things may change between those periods. This leads to a less accurate comparison. Comparing the period you have chosen to the period directly before it gives a more realistic comparison for your decision-making.
How do diminishing returns factor into the Optimization Report?
A diminishing return algorithm is used to estimate the scenario showing what could have happened during a period if you had not made any budget adjustments. This draws upon your past spending and estimates it at different levels.
Does the Optimization Report account for seasonality?
The Optimization Report compares the current or past period you’ve chosen using data that has already occurred. Since it does not project future sales metrics over long periods of time, seasonality does not come into play like with the Media Plan Optimizer, which determines long-term future plans.